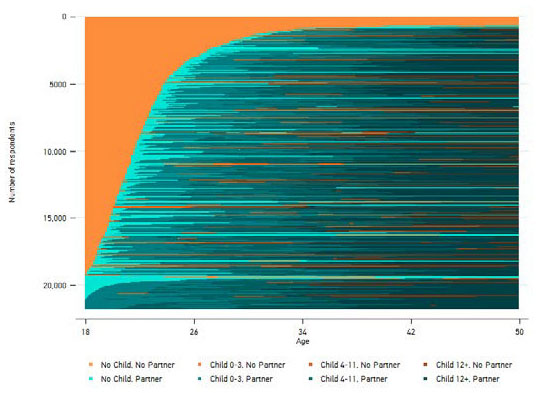
The GGP has very detailed information about individuals life histories and how their circumstances have changed over time. Below we have the life courses of 21,784 women aged 50-60 in 14 countries and how their family status has changed since they were 20 years old. Each line in the graph represents an individual’s life course and their change in status over a 30 year period. Some individuals, like those at the top of the graph, never have a partner and never have a child. Others have children with a partner but then seperate with them and raise the children alone. This image represents over 60,000 years in the life’s of our participants and researchers can then use the rich detail of this picture to examine the causes and consequences of our life stories and find patterns in this tapestry.
Family status of Women between the ages of 20-50 in 14 European Countries