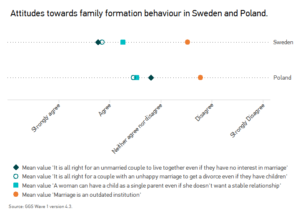
Families in Europe and elsewhere are becoming more complex, with an increasing number of couples living in unmarried cohabitation or experiencing a separation or divorce. The GGP provides data not only on actual family transitions, but also on norms and values regarding family-related behaviour. Figure 1 shows the attitudes towards marriage, cohabitation, single parenthood, and divorce for two countries: Sweden (data collected in 2012/13) and Poland (data collected in 2010/11). Swedes are generally more open to new family forms than Poles. Yet, country differences in attitudes about cohabitation are notably larger than, for example, single motherhood. Also, within countries large differences are found. While on average Swedes believe it is okay for a couple to live together without being married, they do not agree that marriage is an outdated institution. The Swedish case thus shows that the increasing acceptance of new family forms does not necessarily mean a rejection of more traditional family arrangements.
Families in Europe and elsewhere are becoming more complex, with an increasing number of couples living in unmarried cohabitation or experiencing a separation or divorce. The GGP provides data not only on actual family transitions, but also on norms and values regarding family-related behaviour. Figure 1 shows the attitudes towards marriage, cohabitation, single parenthood, and divorce for two countries: Sweden (data collected in 2012/13) and Poland (data collected in 2010/11). Swedes are generally more open to new family forms than Poles. Yet, country differences in attitudes about cohabitation are notably larger than, for example, single motherhood. Also, within countries large differences are found. While on average Swedes believe it is okay for a couple to live together without being married, they do not agree that marriage is an outdated institution. The Swedish case thus shows that the increasing acceptance of new family forms does not necessarily mean a rejection of more traditional family arrangements.
The increase in female labour force participation and dual-earner couples has initiated a continuing discussion in Europe about ways in which families can be helped in combining work and family responsibilities. Uptake of maternity leave and access to high-quality and affordable child care can help families – and women in particular – to combine parenthood and career aspirations. Generally, less attention is paid to care responsibilities for elderly parents. Figure 1 shows that among parents with children younger than 14 living in the household, about 3% has to combine this task with taking care of their parents(-in-law) on a regular basis. Responsibility for (elderly) parents disproportionally falls into the hands of people aged 40-59. Combining care-responsibilities may pose a burden, especially on dual-earner families. Data of the Generations & Gender Programme can help to identify groups in need for support, thereby directing policy development in this area.
Care responsibilities for (elderly) parents among parents with young children in Europe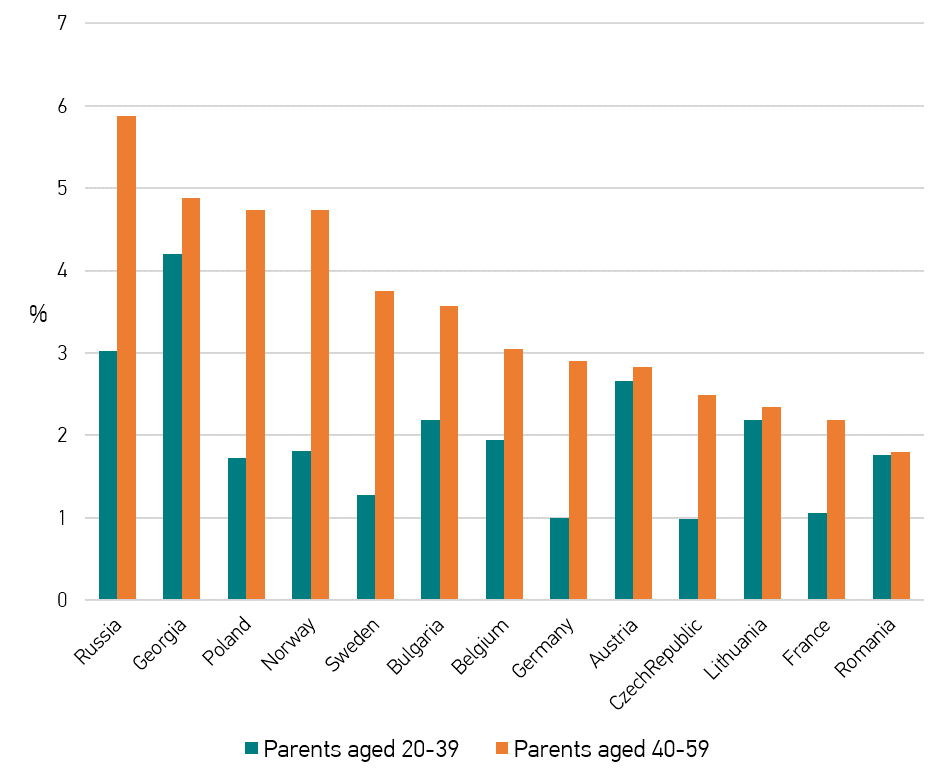
Young adults who are not employed nor in education or training (NEET) are a continuing concern for
European policy makers because of their higher risks of social exclusion and poverty. The graph below
shows the level of life satisfaction for young men and women aged 18-29 years old for two categories:
(1) employed or in education, and (2) NEET. Overall, men and women in the age from 18 to 29 are very
satisfied with their life. However, young adults who are not employed nor in education tend to have a
lower level of life satisfaction. The data furthermore reveal that group differences are much larger in
some countries – such as the Czech Republic and Estonia – than in others. Reducing the proportion of
NEET among young adults is part of the Sustainable Development Goals. Data from the Generations
and Gender Survey can help to unravel the reasons and consequences for NEET across countries,
gender and age-groups.
Life satisfaction among men and women aged 18-29 by activity status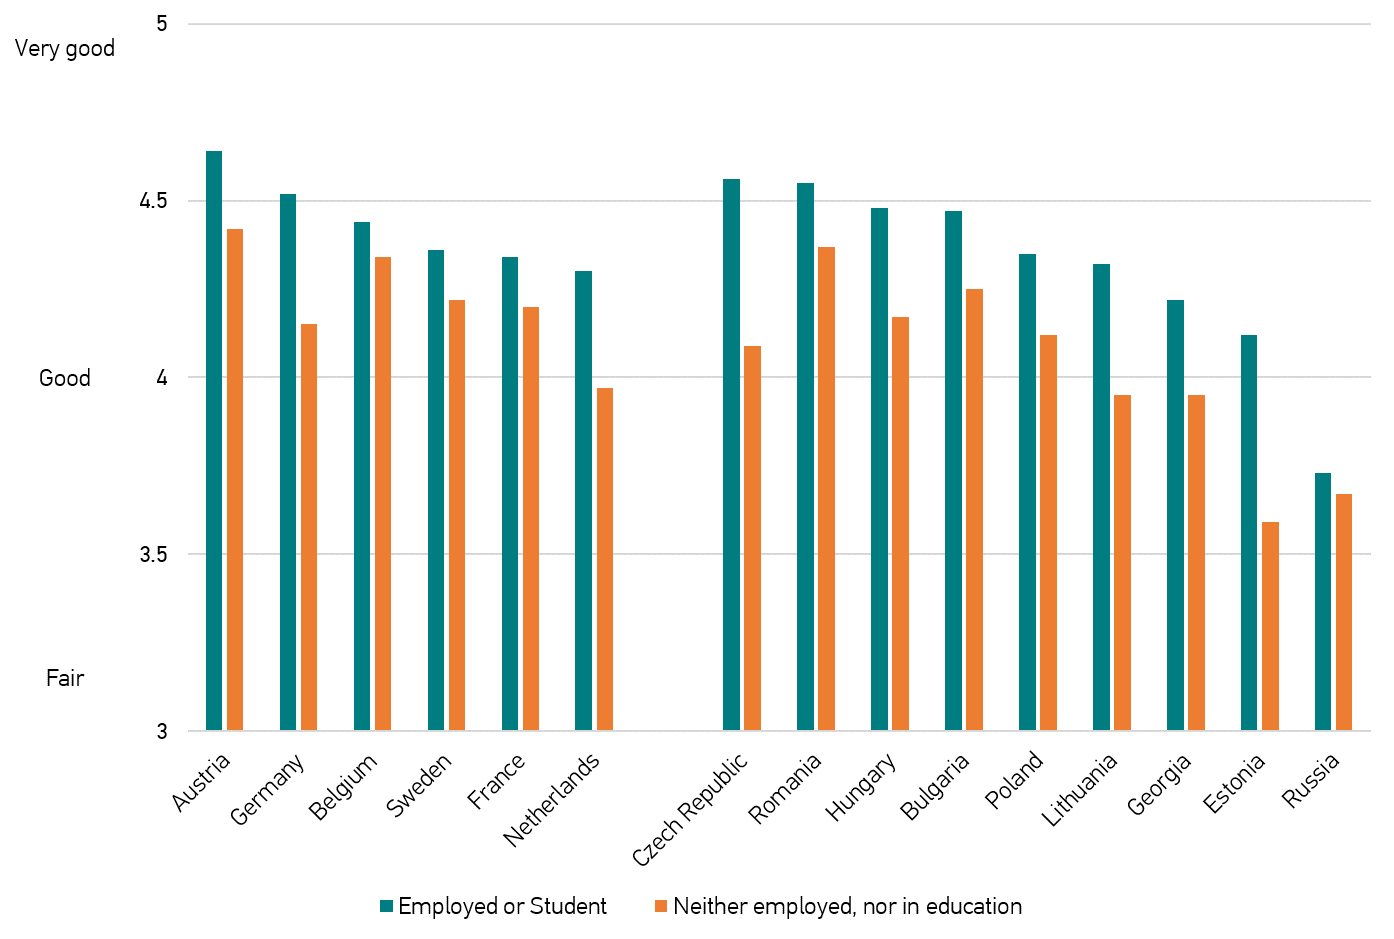
Even though the mean age at childbirth has increased in all countries in the recent decades, a non-negligible proportion of women still give birth at a very early age. The graph below shows the percentage of women of three different cohorts who have given birth before the age of 20. The data reveal a sharp East-West European contrast, with much higher percentages of women experiencing early childbearing in the East than in the West. Among women born in 1975-79, around 4 percent gave birth before the age of 20 on average in the Western European countries represented in the graph, against 17 percent in the East, although with very large cross-national differences. The reasons for early childbearing are complex but often involve a combination of poverty, low education and limited access to contraception. Universal access to sexual and reproductive health-care services and a reduction of adolescent birth rate are at the core of the United Nations Sustainable Development Goals. Data from the Generations and Gender Survey help to monitor these demographic trends.
Proportion of women who gave birth to their first child between age 15 and 20.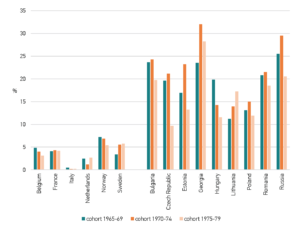
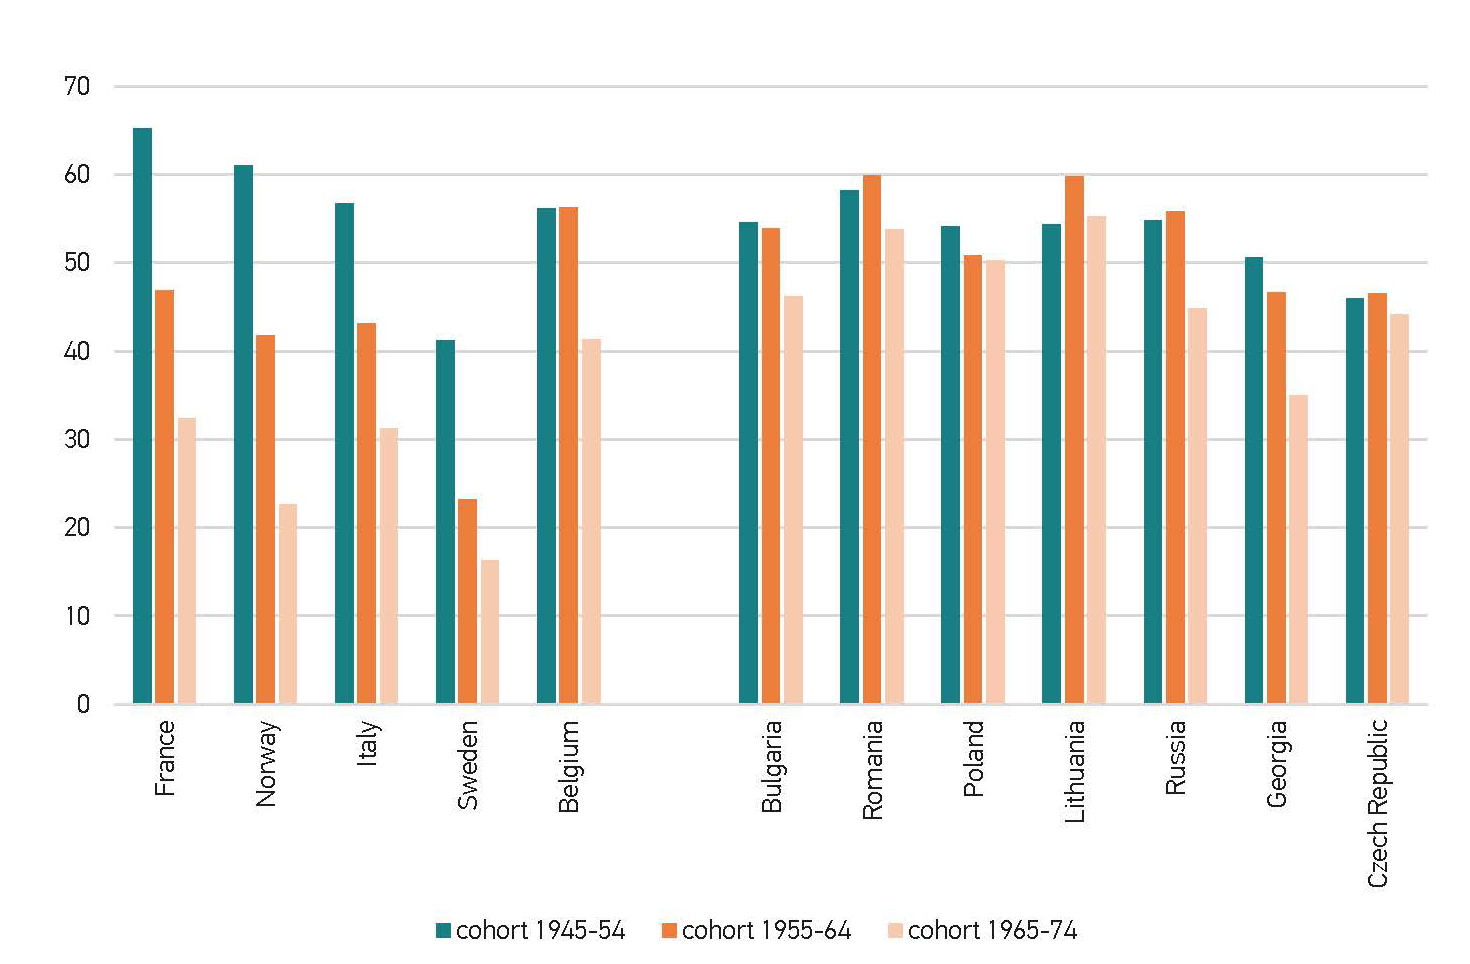
Over the past decades family formation behaviour has diversified in Europe. The graph below, based on the Generations and Gender Survey, displays the percentage of men and women who have followed a traditional pathway in their family formation, that is, they experienced the following sequence of events: they first left the parental home, then married, after which they had their first child, and they experienced all three events before the age of 30. The results show a large decrease across cohorts in the percentage following such a traditional pathway. For example, in France more than 60% of people born between 1945 and 1954 followed a traditional family pathway, while this figure was down to 30% for people born between 1965 and 1974. The changes in family formation behaviour are more pronounced in West-European countries than in Central- and East-European countries.
Percentage of men and women who followed a traditional family pathway in 12 countries by birth cohort